
AB Test Design with Outliers - What is CUPED?

A few weeks ago, we explored the issue of outliers in the context of designing your A/B test and provided potential solutions, such as trimming outliers. Let’s recap:
Why does this matter?
The stakes of your experiment are high. For instance,
A mere 0.1% increase to revenue at Facebook is worth over $100 million per year!
The time to action based on your experiment outcome is mission-critical for your business.
Businesses don’t want their experiments to run for a year just to gather enough sample size. Moreover, features that have a negative impact should be stopped as soon as possible. Therefore, we aim to find ways to decrease the standard error, reduce the sample size, and consequently reduce the learning time from the experiments.
If you need a quick reminder, you can refer to the relevant post here:
CUPED Method
Today we will discuss a different approach called CUPED (Controlled-experiment Using Pre-Experiment Data). Microsoft proposed and named CUPED in 2013, and it has since become widely used in online experimentation.
The guiding principle of CUPED is that not all variance in an experiment are random. In fact, a lot of the differences in user outcomes are based on pre-existing factors that have nothing to do with the experiment.
To demonstrate this concept, consider the simple example as the following:
Suppose we want to test whether people run slower when weights are attached to their bodies (obviously 🤓). We divide the participants into two groups: the test group, which runs with weights, and the control group, which runs without weights. The collected data may appear as follows:

When we observe this data, we might think, how fast these runners are already running might have an influence on the result. How about adding that knowledge to our metric by establishing a baseline?

Now we know that by including the baseline mile time for each runner, the effect of the experiment becomes more apparent. Instead of solely using the “experiment mile time” metric, we now focus on the “change” from the baseline.
By introducing this baseline, we effectively reduce the variance in the metric. Previously, the largest gap between Sally and Bob was 2 minutes and 20 seconds (140 seconds), but now the biggest gap in our metric is only 65 seconds between Jane and Bob. Essentially, we are measuring the incremental change rather than the absolute values.
This is the idea of CUPED!
The goal is to adjust metrics in your controlled experiments by incorporating pre-experiment data for both the control and treatment groups. This adjustment aims to decrease metric variability and increase the sensitivity of the experiments.
Because experimental groups are randomly assigned, there’s a chance that the two groups randomly have different baseline run times. If you’re unlucky, that difference could even be statistically significant. This means that even if the weights did nothing, you might conclude that there’s a difference between the two groups.
This is also the ground for A/A testing!
In the illustration below, on the left hand side, if the baselines are significantly different, it could impact the experiment results even if the treatment has no true effect!
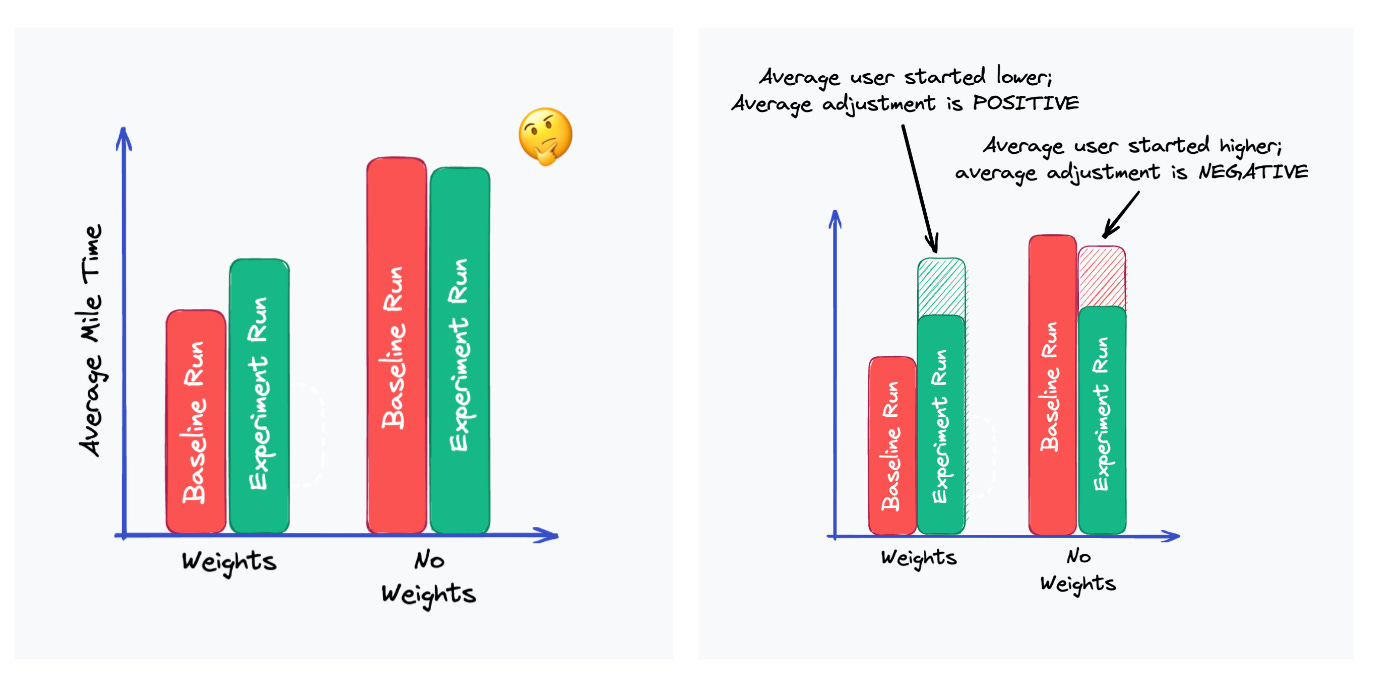
On the contrary, with CUPED adjustment, the average incremental changes can filter out some of the pre-experiment noise and increase the validity of the test.
Let’s observe some P-values
Let’s use OLS (Ordinary Least Squares) to evaluate the experiment effect by regressing test or control flag on the metric of the test (equivalent to a T-test).

In this analysis, we find that the effect size is 7.4617, with a standard error of 4.73. The resulting p-value is 0.116, leading us to conclude that the test result is not statistically significant.
However, to improve the reliability of our experiment, let's introduce the baseline as a covariate, which is exactly what CUPED does. By considering the baseline, we can account for pre-existing factors that may affect the outcome.

The effect size remains around 7, and the baselines has a small effect of 0.9897. This suggests that being in the test group has some consistent effect. Additionally, the standard error of the test effect dropped from 4.73 to 2.134, indicating a reduction in variance. This is due to the fact that the baseline can explain some of the variance!
As a result, the p-value dropped from 0.116 to 0, making the test result clearly significant!
Plotting the distribution of the data further supports these findings.
Using the pre-experiment data reduced the variance, p-value, and the data we would need to consistently see this result.

Takeaways
The key to all controlled experiment is the ability to identify the treatment effect when it indeed exists, commonly known as “power” or “sensitivity” of the test.
Enhancing sensitivity is especially important when running large-scale online experiments. “A mature online experimentation platform runs thousands of experiments a year.”
In reality, even if you have a large amount of traffic, online experiments may not always achieve sufficient statistical power. There are several reasons:
We often would like to detect very small effects.
The sensitivity of controlled experiments is inversely proportional to the number of users squared. For example, while a small site may need 10,000 users to detect a 5% difference, detecting a 0.5% difference requires 100 times (10 squared) more users, or one million users. Even a 0.5% change in revenue per user equates to millions of dollars for large online sites.
It is crucial to get results fast. We would like to launch the good features early, but more importantly, if the treatment is bad for our customers or the business, we need to stop it as soon as possible.
Many experiments have low triggering rates, meaning that only a small fraction of users actually experience the treatment feature. In these cases, the effective sample size can be small, leading to low statistical power.
A strong experimentation and data-driven culture often results in a higher demand for concurrent experiments, which can limit the traffic available for specific experiments.
One key solution here to improve sensitivity is to reduce variance. People have done so by trying out different metrics, trimming outliers or filtering out users who are not impacted by the change.
Today, we also introduced CUPED, which is a method to adjust metrics using pre-experiment data for users in the control and treatment to reduce metric variability. Overall, CUPED allows for more sensitive tests, enabling more non-overlapping experiments to be run.
Hope you learned something new!
If you are interested in the maths behind the scene, please refer to the white paper in the reference section!

Happy practicing!
