

Two weeks ago, we discussed the issue of outliers in the context of designing your A/B test. If you need a quick reminder, you can find the relevant post here:
AB Test Design with Outliers 🤯

Today we’ll discuss a common problem with regards to A/B testing: What to expect when there’re outliers in your population? Two-sample t-tests are widely used for A/B testing when the primary objective is to compare the means of two groups (Group A and Group B) to determine if there is a statistically significant difference between them. It is also a special case of ANOVA (Analysis of Variance).
So what are your options?
There are several options you could choose when dealing with outliers.
The simplest solution is to use the trimmed-mean t-test.
Essentially this is a t-test using the trimmed means of each sample as the means and the Winsorized (trimmed) variances as the variances.
The idea behind this approach is straightforward: if you have data points that are either too big or too small, you throw them away.
Of course, if you have a strong statistics background, you might question the validity of this approach. Simply discarding data points that could potentially represent the distribution may seem hasty.
The answer to this concern is more philosophical than theoretical, and we will explore it in the next section.
But first, let's examine what happens with an example.
In a marketing research study, a firm tested the effectiveness of a new flavoring for a leading beverage. They used a sample of 22 people, with half of them tasting the beverage with the old flavoring and the other half tasting the beverage with the new flavoring (although one person dropped out before the tasting began). Afterward, the participants were given a questionnaire to evaluate how enjoyable the beverage was. Based on the scores shown on the left side below, we will determine whether there is a significant difference between the perceptions of the two flavorings.

Now let’s use the trimmed means t-test to assess whether there is a significant difference between the perceptions of the new and old flavorings.
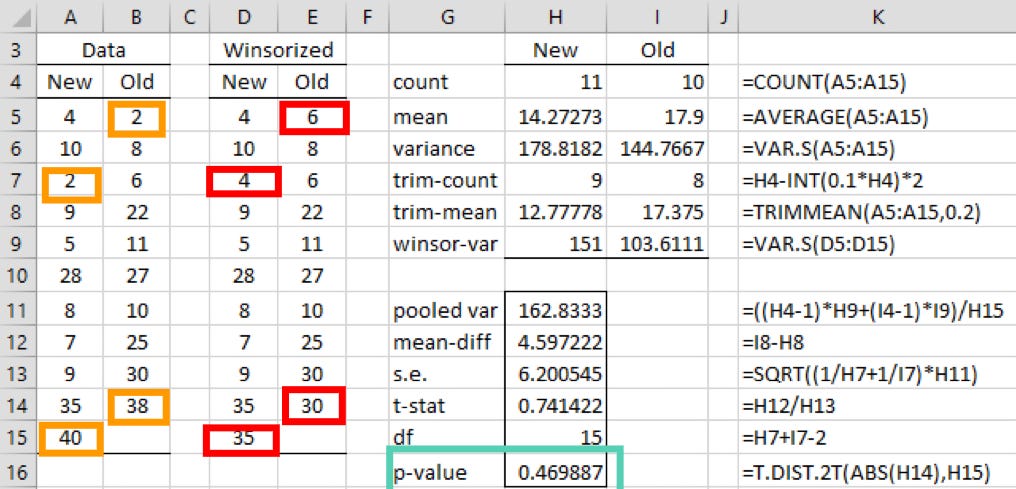
In this example, we performed winsorization by trimming 20% of the extreme values. Specifically, the smallest and largest values in the data (2, 38, and 40 in orange) were replaced with the next closest values in each of the data samples (4, 6, 30, and 35 in red). The t-test was then conducted on the winsorized sample, resulting in a p-value of 0.46. Based on this, we can conclude that there is no significant difference between the two flavorings. (The variances are notably reduced.)
How does this make business sense?
In practice, we trim outliers at a percentage that makes reasonable business sense. For instance, we can perform winsorization at the 99th percentile.
You may ask, how do we justify that? Are the last 1% of users rare cases? Are they not representative of the data distribution?
Well, actually none of those.
For the gaming platform I work with, the 1% of users who takes more “extreme” actions actually account for a notable portion of the population. . They are small compared with the rest, but not completely negligible.
Furthermore, these users are expected to continue their current behavior pattern, such as the "whales." They are likely to continue being high-spending users on the platform and contribute to the "fat" tails of the data. Therefore, we cannot exclude them from the "normal" distribution of user behaviors.
So how could I trim these outliers?
The key thing to remember here is what’s the ultimate goal of your A/B tests.
Typically, an action is expected from the business based on the outcome of an A/B test. Ideally, you want to learn something that you can use to launch your feature to a larger population or make a go or no-go decision based on a proven hypothesis.
From a product manager's perspective, the A/B test may just need to work for the majority of users, which would already have a significant revenue impact.
For users who are more outliers than the majority, the business can explore alternative strategies. For example, in the case of a gaming platform, there may be a separate strategy group for users who exhibit extreme outlier behaviors.
Another solution for the next time
In addition to trimming outliers, another important method to consider is CUPED, which was proposed by Microsoft in 2013. This method has been widely adopted by large consumer app companies and third-party experimentation platforms.
To quote Eppo CEO Chetan Sharma:
We do winsorization at the 99.9th percentile by default so the vast majority of the distribution can be understood with CUPED, winsorization, and standard stat tests.
How does CUPED work?
Stay tuned for more on this topic!

Happy practicing!
Keep reading with a 7-day free trial
Subscribe to The MLnotes Newsletter to keep reading this post and get 7 days of free access to the full post archives.