
AB Test Design with Outliers 🤯
Part I

Today we’ll discuss a common problem with regards to A/B testing:
What to expect when there’re outliers in your population?
Two-sample t-tests are widely used for A/B testing when the primary objective is to compare the means of two groups (Group A and Group B) to determine if there is a statistically significant difference between them. It is also a special case of ANOVA (Analysis of Variance).
In order to make such claims for the population, you’ll have to factor in the random variations in the sample means rather than completely relying on them. Hence, this analysis is named as Analysis of Variance.
An example is when your PM partner reaches out and asks you to design a test to check the overall lift in revenue of a new feature launch, or test the efficacy of a promotion to users’ certain behaviors (could be a paired test). A wide range of metrics could be of interest, including adoption/conversion rate, engagement (views, clicks), purchase (orders, sales) and so on.
So now your PM partner asks you to provide a sample size calculation. What happens?
You know how to do a two sample t-test (Check my previous post about Multiple Testing if you need a reminder!
A/B ⚖ Testing with Multiple Metrics

A lot of literature references and guidance about A/B testing anchor on tests based on one single comparison or one single metric. Some of my friends working in tech also shared that they typically focus on one primary metric when performing experiment designs (e.g., study design and sample size calculation etc.).
).
You get all the stats for the priors ready to be input to G*Power.
But the result came back with over 1 million in total sample size. What do you do?
The Outlier Dilemma
We know that the smaller the effect you want to detect, the larger the required sample size.
We also know that the larger the assumed variance of the population, the bigger the sample size needed.
You discovered that the inflated sample size was a result of extreme outliers in your previous data. Although you anticipate these outliers to be common in the future, you cannot really afford a sample size exceeding one million.
Let's assume you are conducting a paired sample test to evaluate the effect of a promotion.
One of the assumptions of the paired samples t-test is that the differences between the two samples follow a normal distribution. Alternatively, in a practical sense, the mean difference can be reasonably approximated by a normal distribution.
A closely related assumption is that there are no significant outliers in the differences.
In order for your A/B test to yield significant results, your test data must strike a balance between two factors: the mean difference and the standard deviation of the differences.
The presence of outliers can greatly influence the results by impacting these two factors.
Let me illustrate this dilemma:

The table provided above is straightforward and easy to understand. In order to illustrate the impact of outliers, we added one outlier example to Sample 2. Let's denote the difference between the two samples for the 6th pair as X.
Based on the first 5 pairs, it is evident that the mean of Sample 1 is greater than that of Sample 2. If X follows the same trend, it is likely that the test results would reflect this as well.
But really?
Let's examine the test statistics and p-values for various values of X.
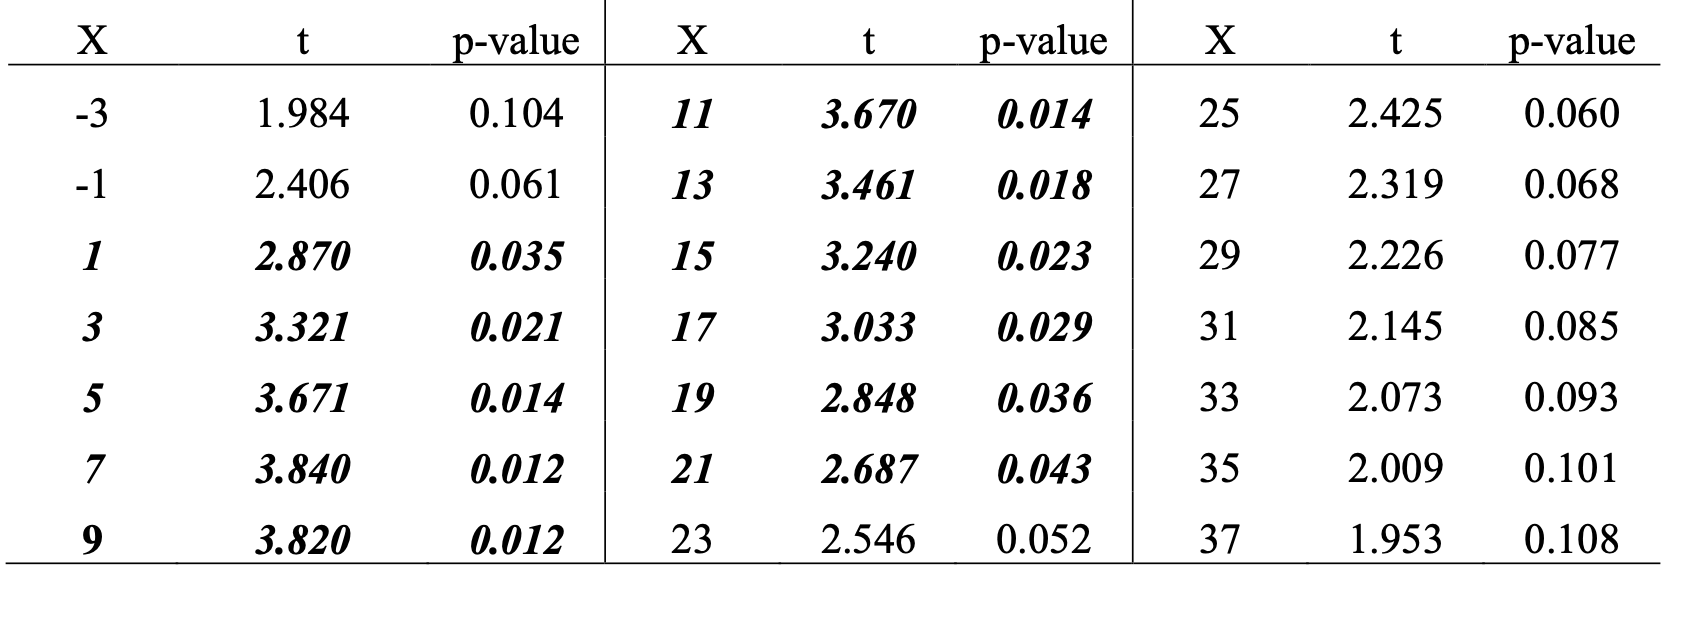
When X is negative or significantly above 10, it indicates a potential outlier. (Defining outliers appropriately is a topic to be covered another time! For now, let's focus on understanding the intuition.)
The bold and italicized rows in the table indicate that the null hypothesis, which states that the means are equal, is rejected at a 5% significance level, with p-values less than 0.05.
As you can observe, as X increases, the p-value initially decreases and then starts to increase again. Eventually, X reaches a point where we cannot reject the null hypothesis anymore (roughly around 23 in this case).
Why does this happen?
Essentially, when an extreme value of X is observed in the direction of the apparent effect, it can cause the sample variance to increase to such an extent that it hinders the test from producing a statistically significant result.
This is the extreme observation paradox.
This phenomenon turns the p-value around as the value of the outlier observation increases in the direction of the overall effect.
For next time
In practice, it is rare for statistical tests to perfectly satisfy all assumptions. Therefore, it is important to understand the robustness of a statistical method to violations of specific assumptions.
The presence of outliers is one indication of a violation of the assumptions of the t-test.
In the case of a two-sided paired samples t-test, the presence of a large outlier that is either in agreement or disagreement with the rest of the sample may result in a failure to reject the null hypothesis.
What can you do with this scenario when designing your A/B test?
Stay tuned!

Happy practicing!
Keep reading with a 7-day free trial
Subscribe to The MLnotes Newsletter to keep reading this post and get 7 days of free access to the full post archives.