

Data Delight: "Weave" Your Way to Interactive Exploration! 🕺💡
Data Delight: "Weave" Your Way to Interactive Exploration! 🕺💡

I'm a passionate advocate of tools that can elevate the Jupyter Notebook experience. Among the various tools my teams utilize, Nbdev has proven to be invaluable. Today, I'm excited to share another tool that has caught my attention from the Fully Connected Conference hosted by Weights & Biases last Wednesday, and that I'd like to introduce:

What is Weave?
Weave is a brand-new open-source toolkit designed for “performant, interactive data exploration” within your familiar environment. Per its authors from Weights & Biases:
Our mission is to equip Machine Learning practitioners with the best tools to turn data into insights quickly and easily.
What’s amazing?
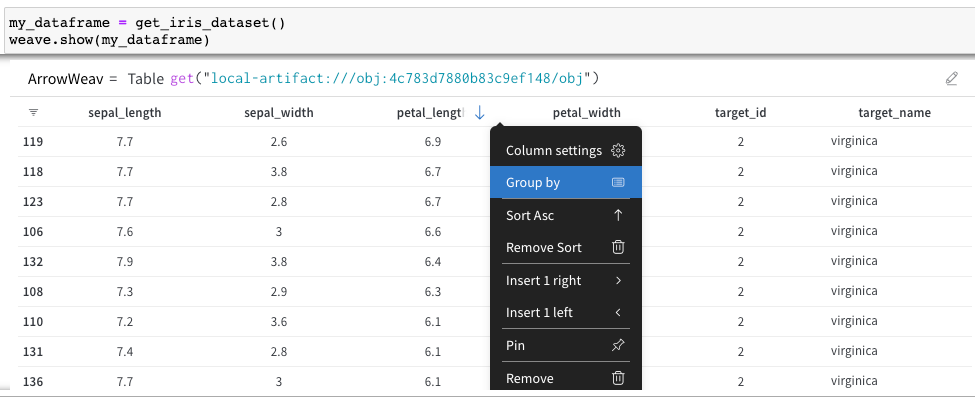
Looks like it’s a new way of displaying and visualizing your data within the cells of your Notebook:

You can perform basic data crunching right there:
You can split the cell to show a plot right there:

You can expand these visualizations into a more complex dashboard, and publish!

Quick test:
You can open the dashboard in another html tab to work with so that you are not working on complex visualization in a single Notebook cell. The“Publish” button didn’t show on this dashboard, perhaps I missed something (let me know if yours worked!)

🎉 Why Weave?
Per their Github:
🚀 Performant:
Weave is built with performance in mind. It's designed to handle large datasets smoothly so you can focus on what matters - exploring data and finding insights. Under the hood we optimize execution plans and parallelize computation using Arrow.
🎨 Interactive:
Weave is all about making data exploration fun and interactive. It empowers you to engage with your data and discover patterns that static graphs can't reveal - without learning complicated APIs! Beautiful and interactive plots to bring your data to life.
🧩 Modular Ecosystem:
Weave's architecture & compute language is build on Types, Ops, and Panels. Combine different components to build your customized data exploration toolkit, and publish reusable components into the ecosystem for others to use!
More examples?
To make it more convenient, here’s a copy of the code for you to start exploring. Weave.show() is not yet working with Colab but it should function properly in non-Colab environments.
Colab playground: here.
We also added the BertViz example for generative text for fun:

In conclusion, I find the concept of interactive visualization within the Notebook quite appealing. Weave appears to be a promising new tool, although there may be a learning curve to fully leverage its capabilities. I haven't had enough time to explore it thoroughly, but I'm excited about its potential!
Happy practicing!
Thanks for reading my newsletter. You can follow me on Linkedin or Twitter @Angelina_Magr!
Source: Weave Github and Fully Connected 2023 Conference by Weights & Biases
Good reads/Colab playgrounds: BertViz attention visualization